What returns can we expect from the stock market?
As of today, the Total Market Index is at
$ 50267.4 billion, which is about
179.8% of the last reported GDP. The US stock market is positioned for an average annualized return of
0.9%,
estimated from the historical valuations of the stock market. This includes the returns from the dividends, currently yielding at 1.32%.
As pointed by Warren Buffett, the percentage of total market cap (TMC) relative to the US GNP is “probably the best single measure of where valuations stand at any given moment.”
GuruFocus modified this measurement by adding the total asset of Federal Reserve Banks in the denominator, arriving at another indicator for market valuation. As of today, the Total Market Index is about 141.8% of the summation of last reported GDP and Total Assets of Fed. The US stock market is positioned for an average annualized return of 1.5%, estimated from the historical market valuation of the newly developed indicator. The modified methodology of this indicator is explained in the Modified Version of Market Valuations section below.
Over the long term, the returns from stock market are determined by these factors:
1. Interest rate
Interest rates “act on financial valuations the way gravity acts on matter: The higher the rate, the greater the downward pull. That's because the rates of return that investors need from any kind of investment are directly tied to the risk-free rate that they can earn from government securities. So if the government rate rises, the prices of all other investments must adjust downward, to a level that brings their expected rates of return into line. Conversely, if government interest rates fall, the move pushes the prices of all other investments upward.”—Warren Buffett
2. Long Term Growth of Corporate Profitability
Over the long term, corporate profitability reverts to its long term-trend, which is around 6%. During recessions, corporate profit margins shrink, and during economic growth periods, corporate profit margins expand. However, long-term growth of corporate profitability is close to long-term economic growth. The size of the US economy is measured by Gross National Product (GNP). Although GNP is different from GDP (gross domestic product), the two numbers have always been within 1% of each other. For the purpose of calculation, GDP is used here. The U.S. GDP since 1970 is represented by the green line in the first of the four charts to the right.
3. Market Valuations
Over the long run, stock market valuation reverts to its mean. A higher current valuation certainly correlates with lower long-term returns in the future. On the other hand, a lower current valuation level correlates with a higher long-term return. The total market valuation is measured by the ratio of total market cap (TMC) to GNP -- the equation representing Warren Buffett's "best single measure". This ratio since 1970 is shown in the second chart to the right. Gurufocus.com calculates and updates this ratio daily. As of 04/19/2024, this ratio is 179.8%.
We can see that, during the past five decades, the TMC/GNP ratio has varied within a very wide range. Based on current value and historical month-end values, the lowest point was about 32.7% in the previous deep recession in July 1982, while the highest point was about 199.5% in August 2021. The market went from Significantly undervalued in July 1982 to Significantly overvalued in August 2021.
Based on these historical valuations, we have divided market valuation into five zones:
| Ratio = Total Market Cap / GDP |
Valuation |
| Ratio ≤ 82% |
Significantly Undervalued |
| 82% < Ratio ≤ 105% |
Modestly Undervalued |
| 105% < Ratio ≤ 129% |
Fair Valued |
| 129% < Ratio ≤ 152% |
Modestly Overvalued |
| Ratio > 152% |
Significantly Overvalued |
| Where are we today (2024-04-19)? | Ratio = 179.8%, Significantly Overvalued |
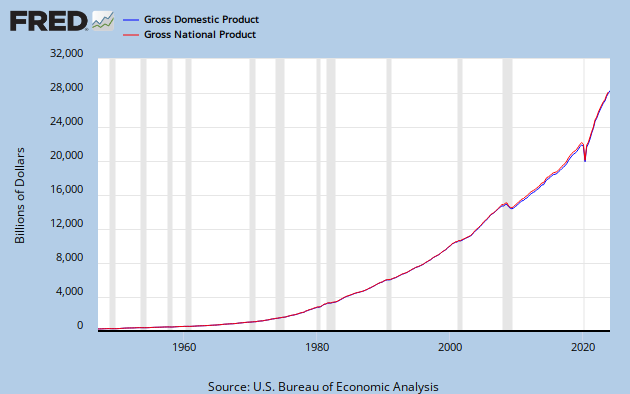
A quick refresher (Thanks to Greenbacked): GDP is “the total market value of goods and services produced within the borders of a country.” GNP is “is the total market value of goods and services produced by the residents of a country, even if they’re living abroad. So if a U.S. resident earns money from an investment overseas, that value would be included in GNP (but not GDP).” While the distinction between the two is important because American firms are increasing the amount of business they do internationally, the actual difference between GNP and GDP is minimal as this chart from the St Louis Fed demonstrates:
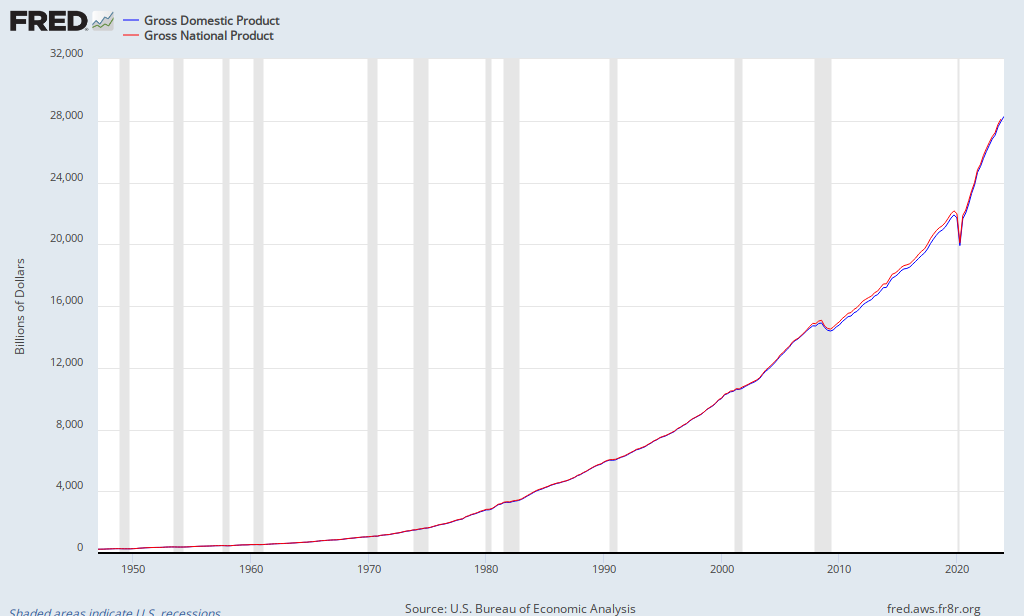
GDP in Q4 2012 stood at $15,851.2 billion. GNP at Q3 2012 (the last data point available) stood at $16,054.2 billion. For our present purposes, one substitutes equally as well for the other.
Modified Version of Market Valuations
To understand the underlying logic of the Buffett Indicator -- the ratio of total market cap (TMC) to GNP, we must understand the economic cycle. The premise is that an economy is mainly driven by consumption and individuals must produce to consume. Corporations generate revenue and profits from the consumption and the profitability will ultimately be reflected in the stock market. Thus, GDP, which reflects the total value of production, is an underlying driving force for the corporate profits as well as the total market cap.
Going deeper, we introduce another factor that might also influence the total market cap, which is the Total Asset of Federal Reserve Bank. Just like any other financial statements, the Fed's balance sheet consists of assets and liabilities. The Federal Reserve, central bank of the United States, issues its weekly H.4.1 report on every Thursday, which provides a consolidated statement of the Condition of All Federal Reserve Banks, including total assets, total liabilities and total capital. The Fed's assets consist primarily of government securities and the loans it extends to its regional banks.
For decades, the Fed balance sheet has been used to predict changes in economic cycles. The expansion and contraction of the Fed's balance sheet can certainly influence the economy and the consumption of individuals and corporates, which consequently influence the stock market. Generally speaking, the Fed buys assets as a part of its monetary policy whenever it intends to increase the money supply and sells assets when it intends to decrease the money supply. If the Fed's goal is expansionary, it pours more money into the market and drifts down the interest rate. In this case, money can be borrowed at a lower rate, which drives individuals to consume and corporate to expand their business. On the other hand, an enormous drop in interest rates also promotes investment, as it makes a dollar of future profit much more valuable. Both results may lead to an inflow into the stock market, thus increasing the total market cap.
Based on the logic, we developed another indicator for market valuation by taking Fed’s total asset into account, TMC/(GDP + Total Assets of Fed) ratio. This indicator operates the same as Buffet Indicator, but gives an additional version. The ratio since 1970 is also shown in the second chart to the right, which gives the overall comparison to the Buffet Indicator. Gurufocus.com calculates and updates this ratio daily. As of 04/19/2024, this ratio is 141.8%.
We can see that, during the past five decades, the TMC/(GDP + Total Assets of Fed) ratio has varied within a very wide range. The lowest point was about 31.1% in the previous deep recession in July 1982, while the highest point was about 149.3% in March 2024.
Based on these modified historical valuations, we have divided market valuation into five zones:
| Ratio = Total Market Cap / (GDP + Total Assets of Fed) |
Valuation |
| Ratio ≤ 68% |
Significantly Undervalued |
| 68% < Ratio ≤ 87% |
Modestly Undervalued |
| 87% < Ratio ≤ 107% |
Fair Valued |
| 107% < Ratio ≤ 126% |
Modestly Overvalued |
| Ratio > 126% |
Significantly Overvalued |
| Where are we today (2024-04-19)? | Ratio = 141.8%, Significantly Overvalued |
The Sources of Investment Returns
The returns of investing in an individual stock or in the entire stock market are determined by these three factors:
1. Business growth
If we look at a particular business, the value of the business is determined by how much money this business can make. The growth in the value of the business comes from the growth of the earnings of the business growth. This growth in the business value is reflected as the price appreciation of the company stock if the market recognizes the value, which it does, eventually.
If we look at the overall economy, the growth in the value of the entire stock market comes from the growth of corporate earnings. As we discussed above, over thelong term, corporate earnings grow as fast as the economy itself.
2. Dividends
Dividends are an important portion of the investment return. Dividends come from the cash earning of a business. Everything equal, a higher dividend payout ratio, in principle, should result in a lower growth rate. Therefore, if a company pays out dividends while still growing earnings, the dividend is an additional return for the shareholders besides the appreciation of the business value.
3. Change in the market valuation
Although the value of a business does not change overnight, its stock price often does. The market valuation is usually measured by the well-known ratios such as P/E, P/S, P/B etc. These ratios can be applied to individual businesses, as well as the overall market. The ratio Warren Buffett uses for market valuation, TMC/GNP, is like a P/S ratio: In this case, the price is the total market cap of all stocks that are traded, and sales is the total gross national product of the country. Moreover, GuruFocus introduces a new indicator, TMC/(GDP + Total Assets of Fed), which acts similarly but gives an additional edition of market valuation.
What Returns Is the Market Likely to Deliver From This Level?
Putting all the three factors together, the return of an investment can be estimated by the following formula:
Investment Return (%) = Dividend Yield (%)+ Business Growth (%)+ Change of Valuation (%)
The first two items of the equation are straightforward. The third item can be calculated if we know the beginning and the ending market ratios of the time period (T) considered. If we assumed the beginning ratio is Rb, and the ending ratio is Re, then the contribution in the change of the valuation can be calculated from this:
(Re/Rb)(1/T)-1
The investment return is thus equal to:
Investment Return (%) = Dividend Yield (%) + Business Growth(%) + (Re/Rb)(1/T)-1
This equation is actually very close to what Dr. John Hussman uses to calculate market valuations. From this equation we can calculate the likely returns an investment in the stock market will generate over a given time period. In the calculation, the time period we used was 8 years, which is about the length of a full economic cycle. The calculated results are shown in the third chart to the right. The green line indicates the expected return if the market trends towards being undervalued (TMC/GNP=0.7 * recent 20-year average) over the next 8 years from current levels, the red line indicates the return if the market trends towards being overvalued (TMC/GNP=1.3 * recent 20-year average) over the next 8 years. The blue line indicates the return if the market trends towards being fair-valued (TMC/GNP=recent 20-year average) over the next 8 years. As of 04/19/2024, the recent 20-year average ratio is 117.14%.
Similarly, based on GuruFocus newly developed indicator, the expected returns are calculated and shown in the last chart. In this case, the last part, change of valuation is replaced by calculating the beginning and ending ratio of TMC/(GDP + Total Assets of Fed), while other parts stay the same. Under the condition that the length of a full economic cycle is 8 years, three different expected returns are estimated based on different assumptions on the market trends: undervalued, overvalued and fair-valued. As of 04/19/2024, the recent 20-year average modified ratio is 97.03%.
The thick bright yellow line in the last two charts at the bottom right is the actual annualized return of the stock market over 8 years. We use "Wilshire 5000 Full Cap Price Index" to do the actual return calculation. We can see the calculations largely predicted the trend in the returns of the stock market. The swing of the market’s returns is related to the change in interest rates.
It has been unfortunate for investors who entered the market after the late 1990s. Since that time, the market has nearly always been overvalued, only dropping to fairly valued since the declines that began in 2008. Since Oct. 2008, for the first time in 15 years, the market has been positioned for meaningful positive returns.
As of 04/19/2024, the stock market is likely to return 0.9% a year in the next 8 years based on TMC/GDP. And it is likely to return 1.5% a year in the next 8 years based on TMC/(GDP + Total Assets of Fed).
Based on these factors, Warren Buffett has made a few market calls in the past. In Nov. 1999, when the Dow was at 11,000, and just a few months before the burst of dotcom bubble, the stock market had gained 13% a year from 1981-1998. Warren Buffett said in a speech to friends and business leaders, “I'd like to argue that we can't come even remotely close to that 12.9... If you strip out the inflation component from this nominal return (which you would need to do however inflation fluctuates), that's 4% in real terms. And if 4% is wrong, I believe that the percentage is just as likely to be less as more.”
Two years after the Nov. 1999 article, when the Dow was down to 9,000, Mr. Buffett said, “I would expect now to see long-term returns run somewhat higher, in the neighborhood of 7% after costs.”
"Nine years have passed since the publication of the article of November 22, 1999, and it has been a wild and painful ride for most investors; the Dow climbed as high as 14,000 in October 2007 and retreated painfully back to 8,000 today." Warren Buffett again wrote in Oct. 2008: "Equities will almost certainly outperform cash over the next decade, probably by a substantial degree."
Related Links:
1. Warren Buffett Stock Picks
2. Buffett-Munger Screener: The stocks young Warren Buffett would buy
3. Market Valuations as measured by Shiller P/E ratio


